
Anda masih selalu kebingungan mencari emas, dalam video ini saya akan bagikan trik jitunya. Klik pada gambar di atas atau via link berikut dibawah jika penasaran. SALAM EMAS !!
Anda masih selalu kebingungan mencari emas, dalam video ini saya akan bagikan trik jitunya. Klik pada gambar di atas atau via link berikut dibawah jika penasaran. SALAM EMAS !!
Filed under News

Bingung dengan potensi emas di lokasi anda? Tidak perlu bingung karena anda bisa mengetahui potensi emas di daerah anda dan sekeliling anda dengan mudah. Saya telah membuat koleksi peta potensi emas di seluruh Indonesia dengan lokasi sebagai berikut:
Untuk mendapatkan peta tersebut silahkan hubungi Whatsapp saya di 082135764488. Jika daerah anda belum terpetakan dapat order atau request peta ke saya dengan menghubungi saya di nomor Whatsapp yang sudah saya sebutkan di atas.
Semoga Sukses, Salam Emas!!
Filed under News

Banyak orang gagal mencari emas di seluruh Indonesia padahal sebenarnya mereka dapat menemukan emas dengan mudah, kenapa? alasannya adalah karena mereka tidak memahami apa itu emas dan bagaimana sifatnya. Setelah dua tahun saya kerjakan akhirnya artikel sebanyak 73 halaman berbahasa sederhana, penuh gambar berwarna, dan berisi ilmu luas yang mudah dipelajari, berhasil saya hadirkan untuk anda.
Anda tidak perlu belajar dengan keras hingga sekolah tinggi, membaca terlalu banyak buku, dan mengikuti pelatihan yang malah membuat anda semakin pusing, STOP BUANG UANG DAN TENAGA ANDA! Cukup duduk dan bacalah artikel ini, dan dalam tempo 1 JAM SAJA, anda akan bisa jadi jawara pencari emas.
Artikel saya berisi:
Fakta Unik Tentang Emas
Indonesia itu Gudang Emas
Mencari Sendiri Lokasi yang Potensial Emas
Menjawab Pertanyaan Besar “Adakah Emas?”
Menjawab Pertanyaan Besar “Apakah Emas Layak Ditambang?”
Sekilas Tentang Teknik Pengolahan Emas
Lebih lanjut silahkan hubungi saya di:
“alva_the_a@yahoo.co.id” atau 082135764488
Atau rasakan dahsyatnya artikel saya dengan download di:
Salam Emas!
Alva Kurniawan
Filed under News

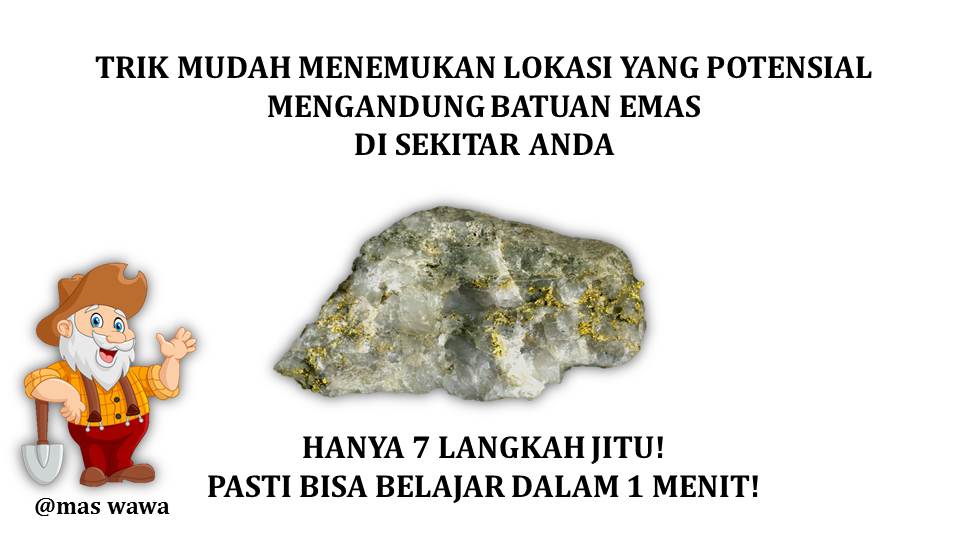
Mendapatkan emas adalah impian semua orang, banyak yang bilang mencarinya sangat sulit namun ternyata ada cara cepat untuk menentukan apakah di tempat anda ada potensi emasnya atau tidak. Caranya adalah sebagai berikut:
Ingat siapa cepat dia dapat, jangan sampai EMAS ANDA DIAMBIL ORANG LAIN!!!.
Salam Emas!
Alva K
Filed under News

Bagi teman-teman yang ingin memiliki basis data Indonesia dalam format SHP silahkan download di
http://redgemsite.wordpress.com/home/
Catatan:
Lakukan perubahan ekstensi dari *.pdf kedalam *.rar dan lakukan ekstraksi pada file yang anda download
Selamat Menggunakan! Gunakan dengan Bijak!
Filed under News
Anda bingung dengan potensi emas di daerah anda? silahkan check apakah tempat anda memiliki potensi emas atau tidak dengan melihat pada peta potensi emas seluruh Indonesia dibawah ini, GRATIS!!
Filed under News

Perbukitan Gendol merupakan sekelompok perbukitan kecil di Salam, Magelang. Perbukitan tersebut membentang dengan arah tenggara-barat laut, dan terletak pada lereng barat daya Gunungapi Merapi. Perbukitan ini menurut Bemmelen (1949) terbentuk sebagai akibat dari longsoran lereng barat daya Gunungapi Merapi yang menabrak batuan dasar Perbukitan Menoreh. Analisis tersebut didasarkan oleh morfologi perbukitan yang berbentuk busur ke arah timur laut.
Berdasarkan teori tersebut maka Gendol seharusnya tersusun oleh material dari Gunungapi Merapi berupa tephra, lahar, breksi, dan batupasir. Seluruh material tersebut bersifat lepas-lepas hingga terkonsolidasi tingkat sedang.

Salah satu bagian Perbukitan Gendol adalah Bukit Sari yang terletak di Gulon. Ada fenomena yang cukup unik yang akan memberikan pandangan lain terhadap teori Bemmelen jika kita lihat interaksi antara Bukit Sari dan S. Blongkeng. Sungai Blongkeng merupakan sungai yang mengalir pada sebelah utara Bukit Sari. Sungai ini merupakan sungai yang berhulu di Gunungapi Merapi. Endapan disekitar sungai ini adalah endapan lahar dari Gunungapi Merapi sehingga sungai ini merupakan sungai yang membawa material lahar dari Gunungapi Merapi.
Aliran lahar mengalir dalam kecepatan yang tinggi sehingga memiliki tenaga yang kuat untuk mengerosi batuan yang tidak terkonsolidasi hingga batuan yang terkonsolidasi tingkat sedang. Pada sisi sebelah utara Bukit Sari dan Gendol, aliran Sungai Blongkeng yang memiliki sejarah mengalirkan lahar dengan kecepatan tinggi ternyata tidak bisa menembus Bukit Sari yang secara teori tersusun oleh material terkonsolidasi tingkat sedang hingga tidak terkonsolidasi. Aliran Sungai Blongkeng yang seharusnya ke barat daya justru berbelok ke utara-barat. Hal tersebut memunculkan pertanyaan besar bahwa material penyusun Bukit Sari yang merupakan anggota Perbukitan Gendol kemungkinan merupakan material yang memiliki tingkat konsolidasi lebih tinggi yang dapat berupa batuan yang lebih kompak yang bukan berasal dari Gunungapi Merapi, atau bahkan batuan yang solid semisal suatu tubuh intrusi.
Filed under News
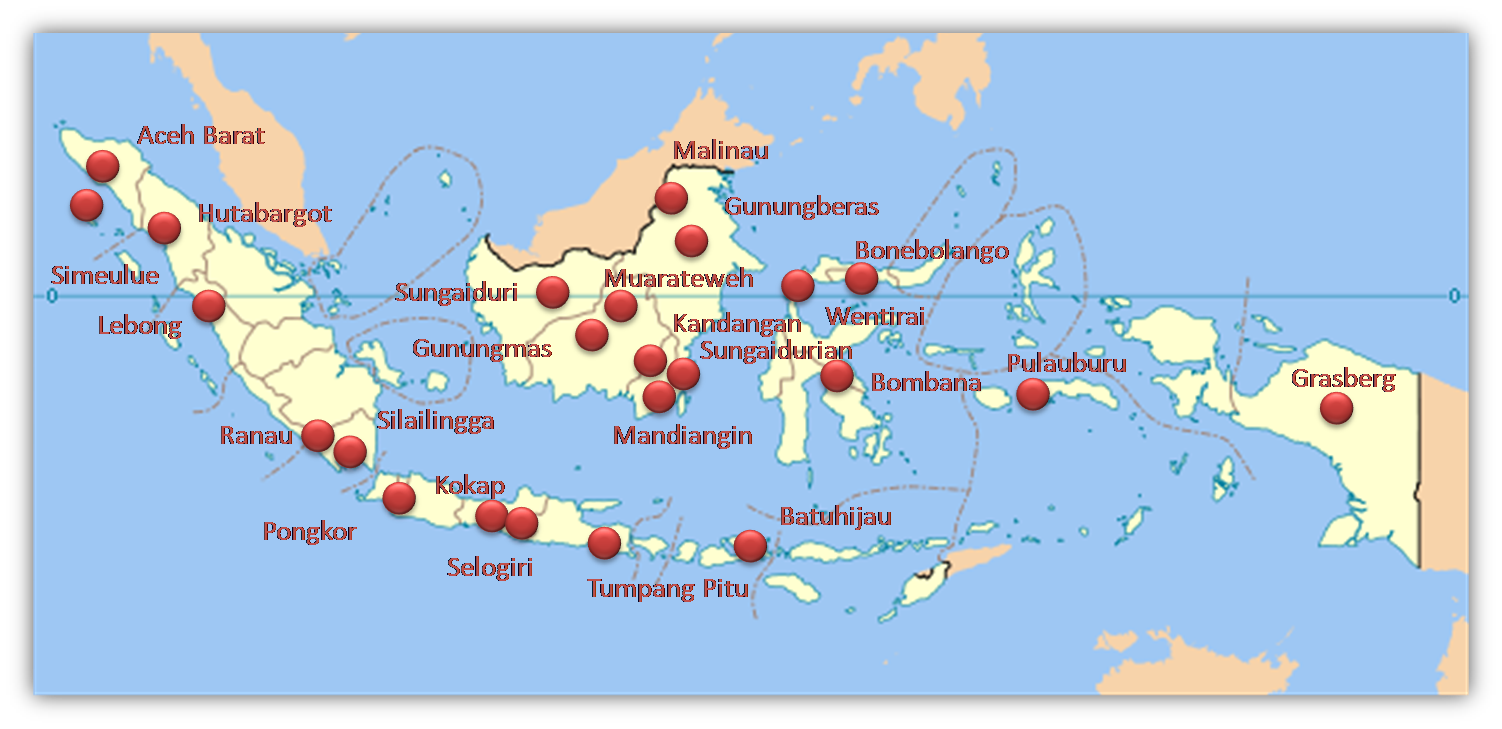
Peta Lokasi Emas di seluruh Indonesia
Sudah tahukah anda kalau kita hidup di GUDANG EMAS? Ya Indonesia adalah negara gudang emas, emas bisa ada dimana aja di Indonesia, bisa jadi dibawah kolong tempat tidur anda ada emasnya. Jangan biarkan orang lain mengamuk emas anda!! Segera CARI TAHU ADAKAH POTENSI EMAS DI TEMPAT ANDA!!
Untuk tahu potensi tempat anda ada EMAS nya atau tidak sangat mudah, berikut caranya:
1. Catat posisi koordinat lahan atau tempat yang anda duga ada emasnya (koordinat lintang dan bujur) menggunakan GPS
2. Jika tidak memiliki GPS sebutkan alamat lengkap lokasi lahan yang anda duga ada emasnya meliputi Desa, Kecamatan, Kabupaten, dan Provinsi
3. Kirim email koordinat maupun alamat lengkap lokasi lahan yang anda duga ada emasnya ke “alva_the_a@yahoo.co.id” atau sms ke 082135764488
4. Untuk tiap lokasi biayanya sangat murah hanya 50.000 rupiah, jika anda ingin peta berikut penjelasannya maka tinggal tambah 150.000 rupiah saja per peta. Jika ada lebih dari 5 lokasi maka anda dapat potongan 50.000 rupiah, dan jika anda memesan lebih dari 10 peta maka anda akan mendapatkan potongan 250.000 rupiah. Pemesanan dapat melalui email ke “alva_the_a@yahoo.co.id” atau sms ke 082135764488
5. Anda akan menghemat biaya yang cukup banyak dengan langkah diatas.
6. Semoga sukses, Salam EMAS!
Filed under News

Anda pasti Bisa!
EMAS merupakan logam mulia yang populer ditambang sejak ribuan tahun yang lalu. Hal tersebut dikarenakan EMAS merupakan logam yang mudah ditambang, mudah diolah, dan menghasilkan keuntungan besar. Mencari EMAS merupakan hal yang tidak sulit, tidak diperlukan keahlian yang khusus untuk mencari EMAS, yang anda perlukan adalah keinginan anda untuk meluangkan waktu membaca tulisan ini SEBENTAR SAJA!!
Langkah-Langkah yang harus anda lakukan adalah:
1. Mengenali apakah terdapat daerah anda memiliki potensi mengandung emas atau tidak.
2. Lakukan survei lapangan, ambil contoh batu dan lakukan pengujian dengan HCl dan Merkuri.
3. Jika positif mengandung emas lakukan perhitungan keuntungan emas jika akan dilakukan penambangan.
Ketiga langkah tersebut mudah dipelajari melalui artikel yang saya susun dengan ringkas dan bahasa yang mudah dimengerti oleh orang awam. Hanya dengan meluangkan waktu anda beberapa jam untuk membaca artikel tersebut maka anda dapat memiliki pemahaman yang dasar yang sangat berguna untuk mengerti tentang emas dan mencari keberadaan emas. Jika berminat klik link dibawah:
Filed under News
Hegarmanah adalah suatu desa di Kecamatan Gegerbitung, Kabupaten Sukabumi, Provinsi Jawa Barat yang memiliki potensi emas. Kegiatan penambangan emas di daerah Hegarmanah dan sekitarnya tidak dapat langsung dilakukan karena cadangan emas yang tersedia belum terukur sehingga keuntungan total yang mungkin diperoleh belum dapat diperkirakan. Penyelidikan kandungan emas yang ada di Hegarmanah dapat dilakukan sebagai langkah awal untuk memperoleh gambaran umum terhadap prospek penambangan emas yang akan dilakukan.
Download Laporan Penyelidikan Sementara Potensi Emas di Hegarmanah
Filed under News

Alva Kurniawan
Geoscience Engineer (地球科学·エンジニア)

